Last summer, we presented an
example of the type of data analysis that could be done using the methods outlined in our book,
Saturday Morning Wake-Up Call. Since that time, coaches from all over the country have sent us requests for the tally sheets and Excel templates in our book. Some coaches have gone so far as to add
me as a coach within their HUDL software in order to allow us to produce data analysis and decision tools for them. Below we present the play distribution data for 4 schools that have done just that.
We present the run play distribution data in Figure 1. The probability distribution function (PDF) for each school informs the coaches (and analysts) of the probability of gaining a specific number of yards in the offense. We should emphasize that the play distributions are derived from full seasons of data from each school, but the data is historical. That is, future results may vary from these historical performances. A quick glance at Figure 1 does not reveal big differences in the offenses between the schools, but the differences (particularly with respect to Pulaski Academy) come out as the data analysis goes forward.
 |
| Figure 1 - Run Play Probability Distribution Functions |
Figure 2 shows the play distribution data from the 4 high schools from passing plays. Again, a quick look does not reveal anything vastly different between the offenses.
 |
| Figure 2 - Pass Play Probability Distribution Functions | | |
|
|
|
The other distribution functions (the cumulative distribution function [CDF] and the complementary cumulative distribution function [CCDF]) derived from the same data set from each school are shown in Figure 3 - Figure 6. Differences in the offensive output of the schools become more apparent in these figures.
 |
| Figure 3 - Run Play Cumulative Distribution Functions |
 |
| Figure 4 - Pass Play Cumulative Distribution Functions |
 |
| Figure 5 - Run Play Complementary Cumulative Distribution Functions |
 |
| Figure 6 - Pass Play Complementary Cumulative Distribution Functions |
The most useful data to a coach in the 4th down decision making process are the CCDFs. Essentially, the CCDF will describe the probability that a team will gain AT LEAST a given number (X) yards. We have built an Excel tool to query the CCDF to give a coach the probability of gaining the yards needed for a 1st down with either a run or a pass play. We can make a sample of this tool available if you request it (
arkansasfootballbloggers@gmail.com).
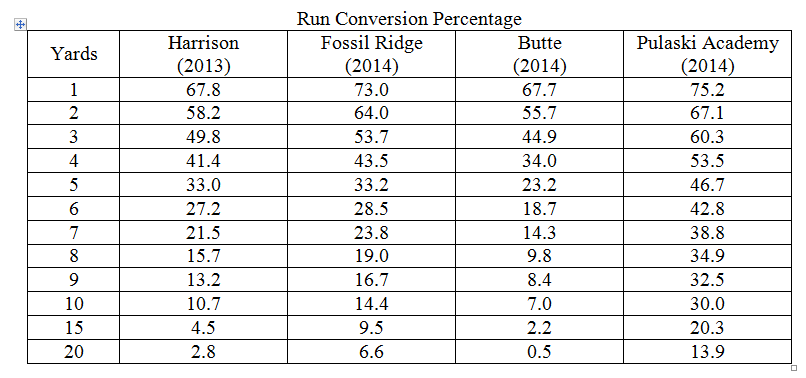
While the decision tool provided by the Excel spreadsheet does not help a coach on the sidelines on a Friday night, the data can be extracted into a useable form. The tables below show examples that would easily fit in a corner of a play sheet allowing a coach to assess the degree of "gambling" with a given play call. However, the full degree of gambling is not known unless he includes the points the other team is likely to score if a conversion fails. We discuss this analysis technique (and a couple of others) in the book.
As a note on the above tables, the conversion probability percentages for Pulaski Academy demonstrate just how potent Kevin Kelley's offense is. He knows that he can depend on ~35-40% conversion percentage on 4th down out to 10 yards to gain. This is an absolutely brutal offense to attempt to defend. To learn more about decision making tools for high school coaches, pick up an eBook copy of Saturday Morning Wake-Up Call at your favorite bookseller for just $0.99.
The paperback version is also available in these retail outlets for just $5.99:


Be it for one of your most loved fun treks or to deal with an over-burden day of authority gatherings, the armada of reasonable auto rental administration in Islamabad will dependably satisfy your need. Islamabad car rent services The table beneath features the few alternatives for auto enlist in Islamabad that you can pick in view of your financial plan and prerequisite.
ReplyDelete